What a system monitor costs
30 July 2026, updated 14 September 2026 · Kevin Stam
I write a system monitor for the macOS menu bar, and its selling point is that it does not cost you much of the machine it measures. Last week I decided to check that claim properly. It turned out to be true only if you never opened a window.
The claim, and the doubt
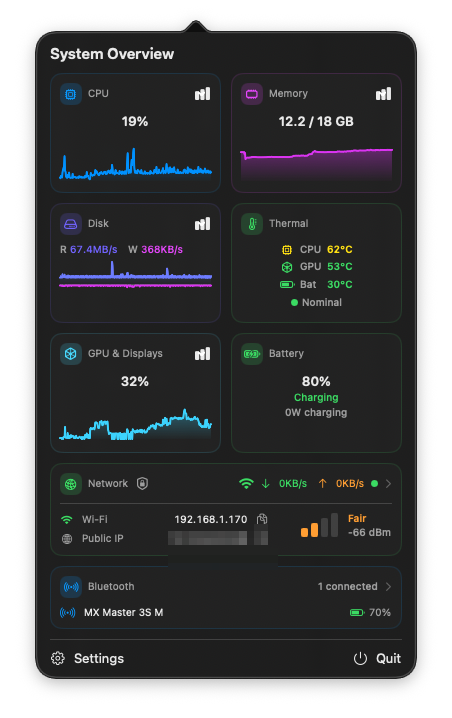
Performance Monitor sits in the menu bar and samples CPU, memory, disk, network, GPU, temperatures and battery. An app like that is in an awkward position: every cycle it spends is a cycle it then reports as used. So the app gates its expensive work on visibility. The ps and nettop process lists, the extended sensor set, per-domain power and per-process disk I/O all run only while a window that displays them is on screen.
That gating went in months ago and the idle figure looked good, so I stopped thinking about it. Then I measured the beta against the released version and got a number I did not like.
First I measured it wrong
Worth admitting up front, because the mistake is the useful part.
My first instinct was ps -o %cpu. That column is not current usage: it is an average over the life of the process. Sampling it repeatedly measures something that converges rather than something that is happening. The project's own benchmark script says so in a comment, which I had written and then ignored.
The second mistake was worse. I ran the beta and the released build side by side, got 4.3% against 1.8%, and concluded the beta had regressed. It had not. The beta had a detail window open and the released build did not, because I had just launched it. I had compared a window doing live chart work against an app sitting idle, and read it as a regression.
The fix for both is the same: verify the state you think you are measuring before you believe the number.
sample <pid> 20 -file profile.txtand, separately, ask the window server what is actually on screen through CGWindowListCopyWindowInfo. If the profile contains a view that should not be mounted, the number is not measuring what you think.
The finding
Once both builds were genuinely idle, with the window list confirming nothing on screen, the profile still contained this:
MemoryDetailView.body.getter    (in Performance Monitor)
  Published.subscript.getter    (in Combine)
  SectionCard<ProcessListView>  (in Performance Monitor)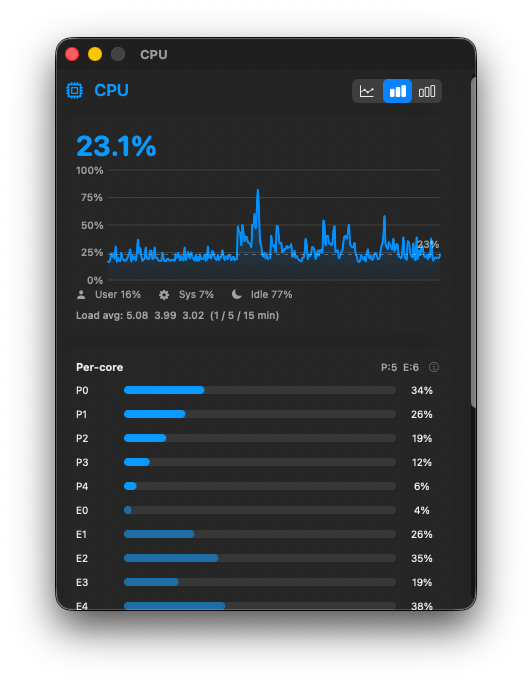
The Memory detail window had been closed for minutes. Its SwiftUI view tree was still alive, still subscribed to the metrics engine, and still re-evaluating its body on every published change. The engine publishes roughly eighty times a second. Nothing was on screen to show any of it.
SwiftUI keeps a scene's view tree after its window closes. That is reasonable behaviour on its own, since reopening is then instant. It stops being reasonable when the tree observes a firehose.
The numbers, measured with the project's benchmark script over four minutes, both builds running at the same time on an M3 Pro:
| State | CPU | Memory |
|---|---|---|
| Fresh launch, no window ever opened | 1.76% | 78 MB |
| After opening and closing one detail window | 4.25% | 108 MB |
One window, opened once, closed again. The cost stayed for the rest of the session and never came back down. The History window was worse: besides its charts it runs a task that re-queries its database every ten seconds, and a task lives as long as the view does. Closing that window left a database query running on a timer indefinitely.
The part that bothers me
This had been found before. Seven days earlier, in fact, by me. There was a comment in the source explaining that the leak existed and had been deliberately left alone:
"Measured here at roughly 60 to 97 sizeThatFits samples out of ~6000 ... The difference was below the noise floor (6.5% after open/close vs 6.9% with nothing ever opened) ... That is a visible regression traded for an unmeasurable gain, so it stays as is. Revisit only if a future change makes this measurable."
- Leak found and measured: 6.5% after open and close, against 6.9% with nothing opened. Correctly judged to be noise, and left in place with a comment saying to revisit if it ever became measurable.
- An unrelated change stops the top-level scene from observing the engine. The idle floor drops from 5.3% to 2.5%. The condition in that comment is now met, and nobody notices.
- Found again while chasing a different number. Same bug, now the largest single cost of an idle app.
- Fixed. Window scenes unmount their content while hidden. Zero view frames in the profile afterwards.
That call was correct when it was made. Against an idle floor of nearly 7%, an extra couple of percentage points genuinely was noise.
What makes it interesting is what happened next. Later the same evening, a separate change stopped the app's top-level scene from observing the engine, and the idle floor dropped from 5.3% to 2.5%. The same absolute cost was suddenly the largest single thing the app did while doing nothing.
The comment had even written its own trigger: revisit only if a future change makes this measurable. That change landed a few hours later, and nobody went back. A conditional decision was recorded correctly and then quietly expired, because the condition was written where a person had to notice it rather than somewhere a tool would.
I do not have a tidy answer for that. Lowering a floor turns yesterday's noise into today's dominant cost, and dismissals age worse than fixes do.
A second thing, found while looking
An audit of what runs per tick versus what is actually displayed turned up something separate. The latency figure in the Network window was measured by a timer started at launch and never stopped, firing a real HTTPS request at an external host every five seconds for the entire session. Over seven hundred requests an hour, for a number displayed in one window that is usually closed.
That is not a large amount of CPU. It is radio wakeups, battery, and unprompted outbound traffic from an app whose main promise is that nothing leaves your machine. It now starts when the Network window becomes visible and stops when it goes away. Measured over a minute, with both builds running:
| Build | Network traffic in 60s |
|---|---|
| Before | 10,751 bytes |
| After | 271 bytes |
Bytes sent and received per minute, app idle.
Where it ended up
Window scenes now unmount their content while hidden, driven by the same occlusion and close events that already gated the samplers, so the view tree and the sampling gate cannot disagree about whether a window is on screen. After real use, including opening and closing several windows, the profile contains zero DetailView, MetricChart and Charts frames, against 24, 56 and 840 for the build without the fix.
| Build, after a window had been opened and closed | CPU | Memory |
|---|---|---|
| 1.1.0 | 4.18% | 89 MB |
| 1.2.0 | 2.21% | 99 MB |
Roughly half. Not all of it: a window that has been opened and closed still costs about half a percentage point and thirty-five megabytes over a fresh launch, so something beyond the content tree is still retained. That is written down and not yet chased.
One note on the scale, because it is easy to compare the wrong things. Every percentage here is a share of a single core, which is what ps and top report for a process. The app's own process list divides that by the core count instead, so it shows a share of the whole machine and a much smaller number for the same work. Neither is wrong; they answer different questions.
The four states, kept apart
Three numbers have appeared so far and they belong to different situations, which is easy to lose track of. All four states, in one place:
| Version and state | CPU | Memory |
|---|---|---|
| 1.1.0, fresh launch, no window ever opened | 1.76% | 78 MB |
| 1.1.0, after one window opened and closed | 4.25% | 108 MB |
| 1.2.0, fresh launch, no window ever opened | 2.41% | 77 MB |
| 1.2.0, after one window opened and closed | 2.21% | 99 MB |
The comparison that matters is between the two rows in the same state. In the state a real user ends up in, having opened a window at some point, 4.25% became 2.21%. The two fresh-launch rows are the honest cost of the release: 1.2.0 does more than 1.1.0, and it shows.
How solid are these numbers
The 1.2.0 idle figure is the one worth pinning down, since it is the headline. Eight consecutive two-minute runs, app freshly launched, no window ever opened:
| Runs | Mean | Std dev | Range |
|---|---|---|---|
| 8 | 2.41% | 0.08 pp | 2.31% to 2.51% |
Within one session the measurement is tight. Between sessions it is not: separate runs taken over several days, with different things running on the machine, landed anywhere from 2.10% to 2.67% for the same build. So the number is reproducible to about a tenth of a point if you measure back to back, and to roughly half a point if you compare across days. The other figures on this page are single runs and should be read with that in mind.
Everything here was measured on one machine: an Apple M3 Pro, 11 cores, 18 GB, macOS 26.5.2, in ordinary use rather than in a quiet room. These are not universal figures, and the point of publishing the script is that you should not have to take them as such.
The memory, honestly
An earlier version of this page said the memory figure went up because 1.2.0 added per-domain power measurement and per-process disk I/O. That was a reasonable guess and it is wrong.
Compared fresh to fresh, 1.1.0 sits at 78 MB and 1.2.0 at 77 MB. The new features cost essentially nothing. The higher numbers, 99 MB and 108 MB, only appear after a window has been opened, and they are the same retention story as the CPU: something is held after the window closes. Unmounting the content recovered most of the CPU cost and less of the memory. A window that has been opened and closed still costs about thirty-five megabytes over a fresh launch.
What I cannot tell you is what that thirty-five megabytes consists of. Separating retained view state from allocator behaviour and from whatever SwiftUI caches per scene needs a heap profile I have not taken. The analysis stops here, and saying so seems better than an explanation that sounds tidy.
A second round, six weeks later
Version 1.3.0 went out in September and I went looking again, this time by timing every step of the metrics tick inside an instrumented build rather than reasoning about which sampler looked expensive. Two things turned up, and neither was the one the project's own notes had flagged as the prime suspect.
GPU utilisation was taking 6.17 ms of a 10.26 ms tick. The read walked the IOKit accelerator node, copied its entire property dictionary with IORegistryEntryCreateCFProperties, and pulled one key out of the result. On Apple Silicon that dictionary is large. Asking for only the key that was wanted measures 0.025 ms against 1.59 ms, and caching the service handle between reads takes it to 0.017 ms.
The second was noisier in every sense. Bluetooth ran system_profiler SPBluetoothDataType every 25 seconds, whether or not anything on screen showed a Bluetooth device. That is a subprocess costing 0.05 s of CPU per call, around 0.2% of a machine doing nothing, for battery percentages visible only in the overview popover and one window.
| Build | Mean | Range | Spread |
|---|---|---|---|
| before | 2.29% | 1.92% to 3.12% | 1.20 pp |
| after | 1.86% | 1.82% to 1.90% | 0.08 pp |
Four sixty-second runs of each, alternating builds on one machine so nothing else could drift between them. The consistency matters as much as the average: what was removed was the bursty work, so the figure stopped jumping.
The round that found nothing
Then I did it again, and this is the part worth publishing.
I gated the remaining per-panel work: the volume enumeration only the Disk window reads, the interface and DNS lookups only the popover and Network window read, and the assignments that republish a value identical to last tick's. All of it removes real work. Measured one build at a time across an afternoon, the figure fell from 1.86% to 1.44% to 0.96%, which looked like a 37% improvement and would have made a good line in a changelog.
It was not true. Measured back to back, alternating the two builds within the same ten minutes, they came out at 1.11% and 1.10%. Nothing. The fall was the machine growing quieter over an afternoon, and I had been comparing builds measured hours apart.
The changes stayed in, because the work really is redundant and gating panel data on panel visibility is the pattern the rest of the app follows. But they are in the release notes as housekeeping, not as a number.
Three more ways I measured it wrong
The first time round there were two. This time there were three, and all three produced confident, plausible, wrong figures.
- A lazy image measures nothing. Timing the menu bar drawing gave 0.001 ms per image, which should have been suspicious.
NSImage(size:flipped:)does not run its drawing block until something rasterises the image, so the loop had measured allocation. Forcing rasterisation gave 0.31 ms, three hundred times more. - Wall clock across an
awaitis latency, not cost. My first instrumented build timed each step withDate(). Under load that attributes descheduled time to whichever step happened to be suspended, and memory sampling appeared to take 17 ms. Switching toclock_gettime(CLOCK_PROCESS_CPUTIME_ID)put it back at 0.34 ms. - A probe in isolation is not the app. Measured standalone, a CoreWLAN interface query costs 3.76 ms and looked like the biggest per-tick target on the list. Measured inside the running app it costs 0.03 ms. The error runs both ways: the network lookups measured 0.3 ms standalone and 1.03 ms in place.
The thread through all five mistakes, across both rounds, is the same. Every one came from measuring something adjacent to the question and trusting the answer because it was precise. Precision is not accuracy, and a figure you obtained yourself is the easiest one to believe.
Measure your own
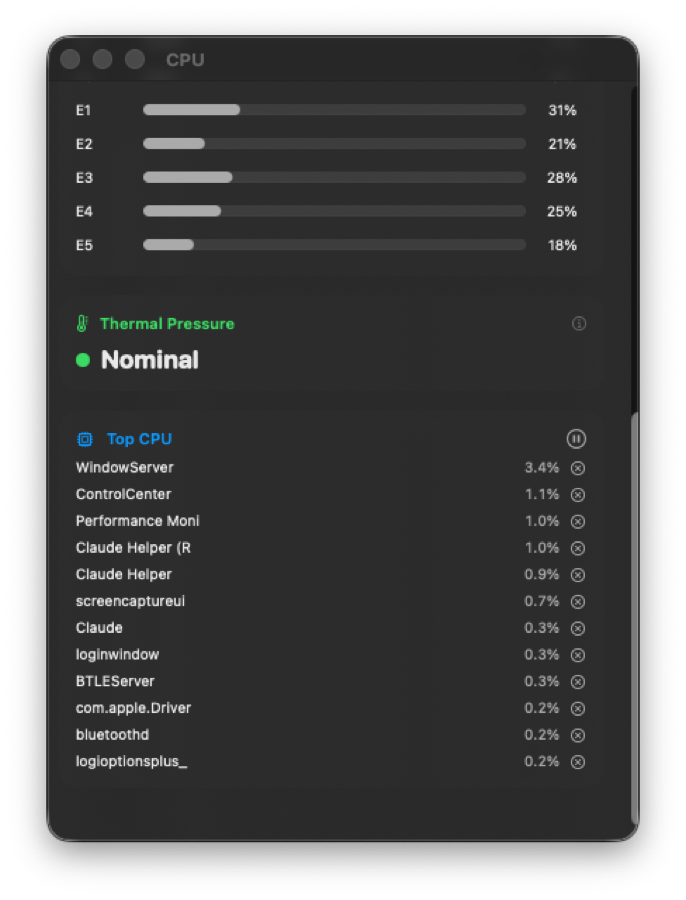
The script is in the repository and it takes no arguments to be useful. It samples cumulative CPU time and divides by elapsed wall time, which is the measurement ps -o %cpu does not give you, and it sums every process belonging to an app rather than only the visible one.
bash scripts/benchmark.sh -d 5 -i 10 -l "idle"It knows about several menu bar monitors and reports on whichever are running, so you can put yours next to mine, or next to each other. I have deliberately not published comparisons with other apps here, because I have not measured them under conditions I would defend, and a benchmark of someone else's software run carelessly is worse than no benchmark.
Before you trust a number:
- Close every window and confirm it with the window list, not by looking.
- Profile once and check nothing is mounted that should not be.
- Compare like with like. Both builds idle, or both with the same window open.
- Use CPU time deltas, not
ps -o %cpu. - Run it more than once. There is real variance between runs.
- Measure the builds you are comparing back to back, not hours apart. A machine's own load drifts more than most fixes are worth.
If you do run it, one thing matters more than the numbers: check what state you are actually in. Close everything, confirm with the window list, and profile once to see what is mounted. Across two rounds of this I got the measurement wrong five times, on an app I wrote, with the script I wrote open beside me.
Performance Monitor is free and open source. The app, the source, and the benchmark script.